Data Collection
Curriculum content descriptionsInterpret and compare a range of data displays, including side-by-side column graphs for two categorical variables (ACMSP147)
******Data presented using a particular approach can be reorganised, refined, reduced or refocused to convey a particular message for a particular purpose******
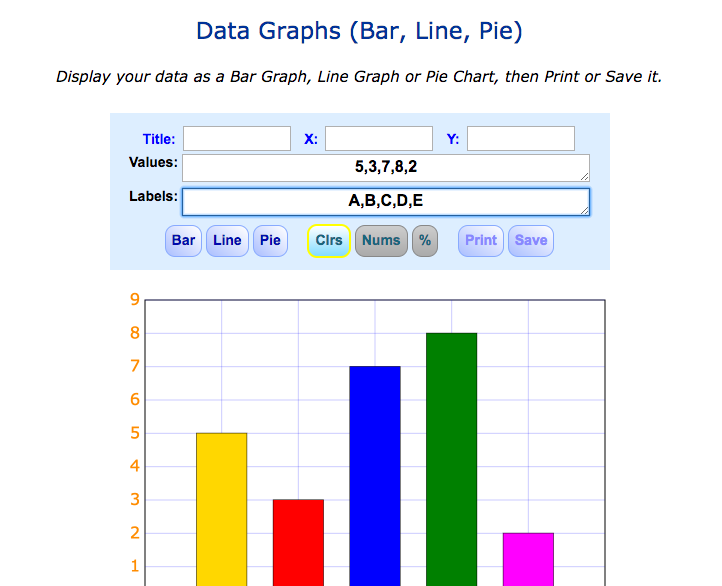
Lesson focus- using authentic data collected to create a digital display of your data collection
Use your own 'HaSS' business data to create a digital graph of your results.
Lesson focus: To what extent are students able to:
- describe features of each type of graph they have explored?
- explain why one graph might be more suitable than another for a particular data set?

Record your answers to these investigation questions in your maths book- remember our Anchor chart for what to include in good reading responses.
|
Creating Column Graphs
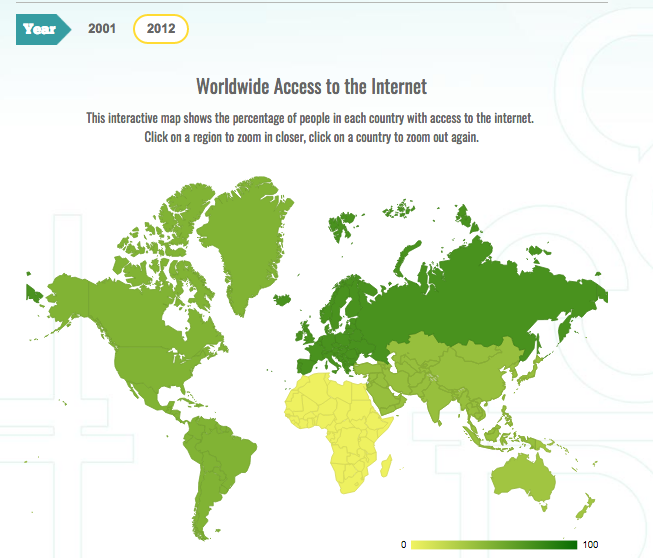
You will explore how access to the internet has changed between the years 2001 and 2012 for selected countries, using the choropleth map 'Worldwide Access to the Internet'
Lesson Focus: Learning intention: To take a data set and re-represent it in a meaningful way.
Re-represent data as a side-by-side column graph that will show changes over time in one visual representation.
|
